Optimize your customer service: 10 KPIs to track in 2025

Why track indicators?
With the emergence of new artificial intelligence (AI) tools and automation, companies now have powerful technologies to optimize their customer interactions. However, to fully benefit from these innovations, it is necessary to closely monitor the key performance indicators (KPIs). Discover in this article the 10 key KPIs of customer relationship, which will help you stay competitive in 2025.
1. Customer Effort Score (CES)
The Customer Effort Score (CES) measures how easy it is for a customer to resolve an issue. It is calculated by asking customers to evaluate the effort required to complete a task on a scale, usually from 1 to 7.
A study by Gartner shows that 96% of customers who reported low effort are more likely to repurchase, while only 9% of those who faced high effort remain loyal.
In 2025, automation with chatbots and callbots will help reduce this effort by providing instant and effective responses.
2. Average Handling Time (AHT)
The Average Handling Time (AHT) measures the time taken by an agent or system to resolve a customer request. It is calculated by dividing the total time spent by the number of interactions. AI and automation tools, such as speech analytics, can reduce AHT by analyzing complex requests and providing quick and tailored responses.
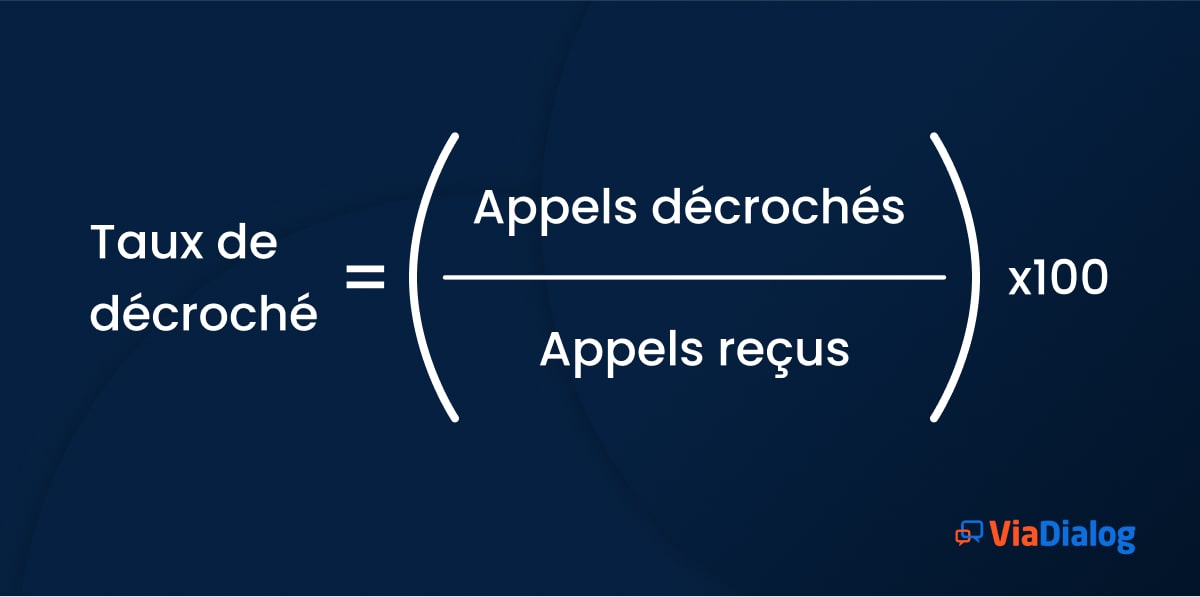
3. Abandonment Rate (AR)
The Abandonment Rate (AR) is the percentage of incoming calls that a contact center answers within a given timeframe. It is calculated by dividing the number of answered calls by the total number of calls received.
Predictive AI algorithms can help anticipate call spikes, automatically allocating available agents or offering automated options (callbots) to improve the AR.
4. First Contact Resolution Rate (FCR)
The First Contact Resolution Rate (FCR) measures the proportion of requests resolved during the first interaction. It is calculated by dividing the number of cases resolved at first contact by the total number of requests. A study by Service Quality Measurement Group reveals that for every 1% increase in FCR, contact centers see a 1% reduction in operational costs.
Automation, particularly through chatbots, allows quick resolution of simple requests, thus increasing the FCR.
5. Customer Retention Rate (CRR)
The Customer Retention Rate (CRR) measures customer loyalty by calculating the percentage of customers remaining over a given period. It is crucial because it often costs 5 times more to acquire a new customer than to retain an existing one.
A study by Harvard Business Review shows that a 5% increase in retention rate can lead to a profit increase of 25 to 95%. In 2025, AI and predictive analytics will help identify at-risk customers, allowing for targeted preventive interventions.
6. Churn Rate
The Churn Rate measures the percentage of customers who leave a company. It is calculated by dividing the number of customers lost by the total number of customers over a given period. Reducing churn can significantly increase profitability. The use of speech analytics tools can identify early warning signs indicating a risk of attrition, such as negative emotions expressed during calls or frequent complaints.
7. Customer Satisfaction Score (CSAT)
The Customer Satisfaction Score (CSAT) is used to measure customer satisfaction after an interaction. It is often measured by a simple question: "How satisfied are you?" with responses on a scale of 1 to 5 or 1 to 10. According to McKinsey, companies that optimize their CSAT see a 2.5% increase in their revenue for every point gained. Tools like chatbots and conversational AI allow rapid resolution of frequent requests, thus increasing CSAT.

8. Quality of Service (QoS)
The Quality of Service (QoS) is measured by customer surveys evaluating criteria such as responsiveness, courtesy, and agent competence. Tools such as SERVQUAL measure the gaps between customer expectations and their perception of the services received. Automating surveys and real-time voice analysis enhances the perceived quality of service continuously.
9. Net Promoter Score (NPS)
The Net Promoter Score (NPS) evaluates customer loyalty by measuring their willingness to recommend a company. It is calculated by asking customers: "How likely are you to recommend our company to a friend or colleague?" Responses are rated from 0 to 10, and the NPS is calculated by subtracting the percentage of detractors (0-6) from the percentage of promoters (9-10). Generative AI allows customization of interactions to improve this tendency.
10. Cost per Interaction
The Cost per Interaction measures the financial efficiency of customer service operations. It is calculated by dividing the total costs of managing interactions by the total number of interactions. A study by Deloitte shows that companies adopting intelligent automation reduce their cost per interaction by 20 to 40%. Chatbots and callbots allow handling large volumes of requests at lower costs while maintaining a high level of satisfaction.
Conclusion
In 2025, success in managing customer relationships will lie in balancing technological innovation with optimizing human interactions. Closely monitoring these 10 KPIs, combined with integrating AI, automation, and predictive analytics, will be essential for providing a seamless, personalized, and competitive customer experience.